Create a Report in TWINALIZE
TWINALIZE gives you the tools to create customized reports for better visibility and control over your IT landscape.
This guide walks you through the steps to create, format, and save a report with just a few clicks.
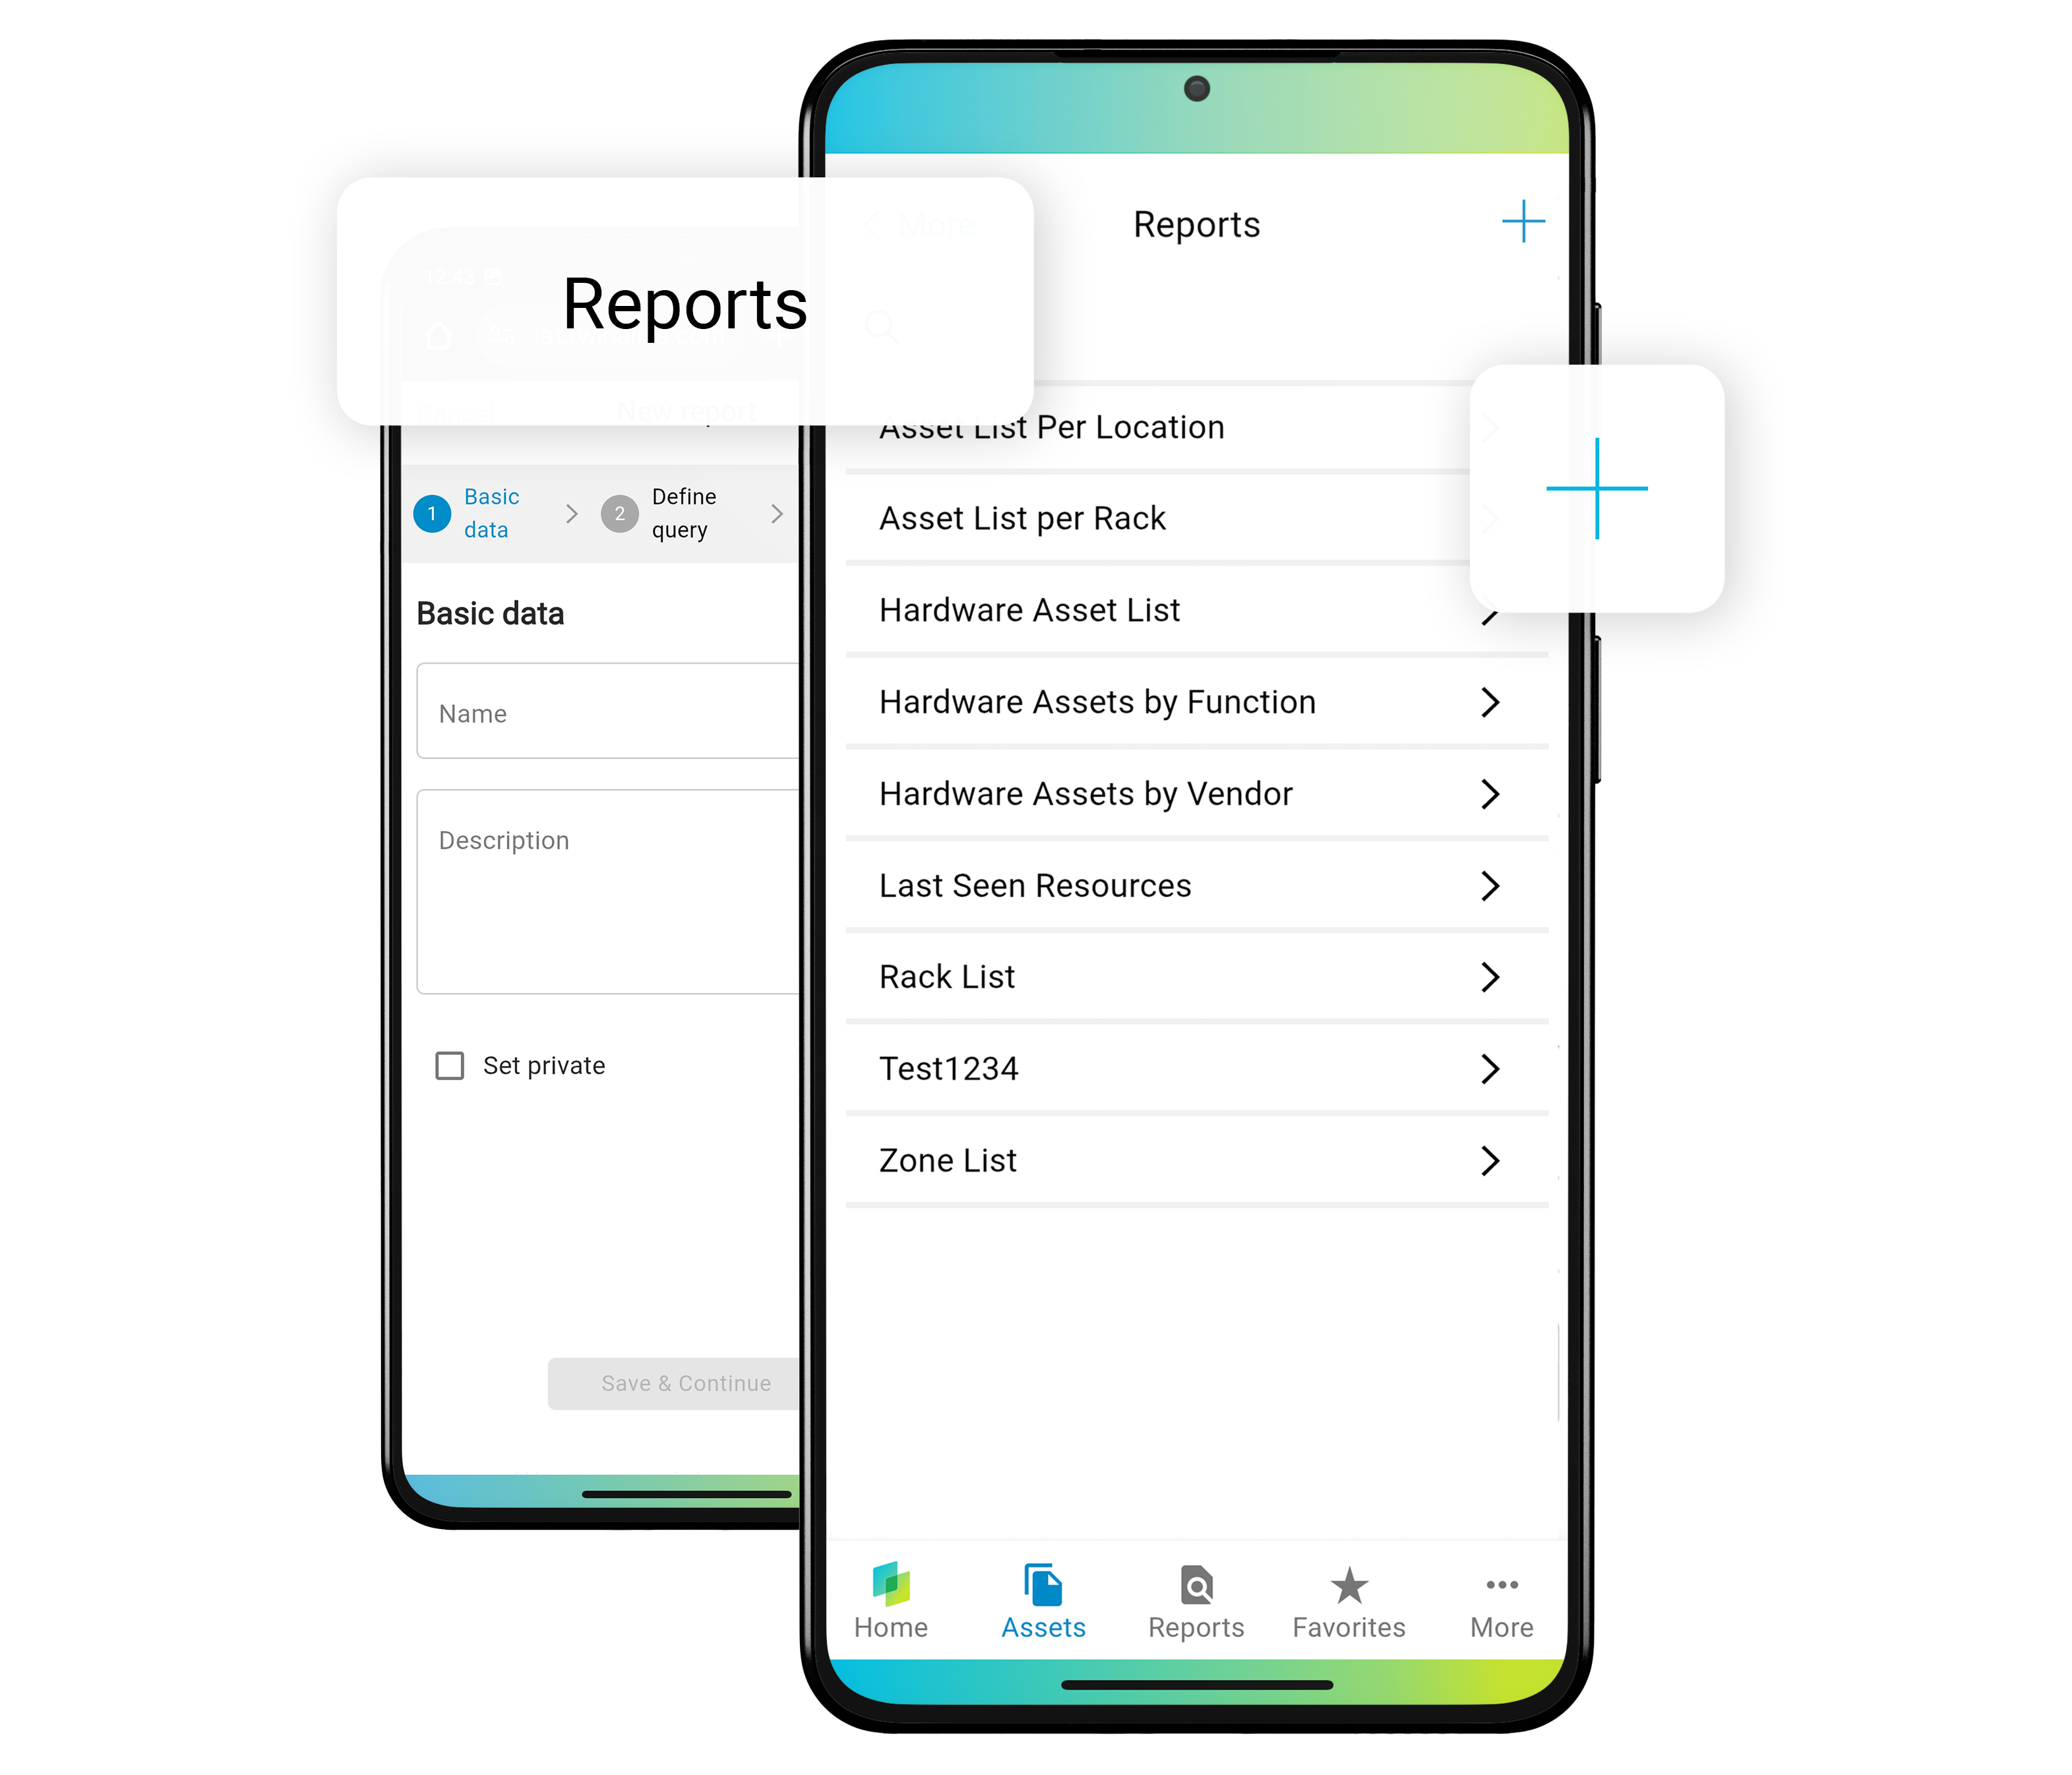
1. Navigate to the Reports section
Start by opening the Reports section. If you're on a desktop, you'll find it in the sidebar. On mobile, tap the Reports icon in the bottom menu.
Once there, click Create New Report or tap the + icon in the top right and select Create New Report from the dropdown.
Enter a name for your report - this is required and helps you identify it later.
Optionally, you can add a short description. Decide whether the report should be private or visible to your team.
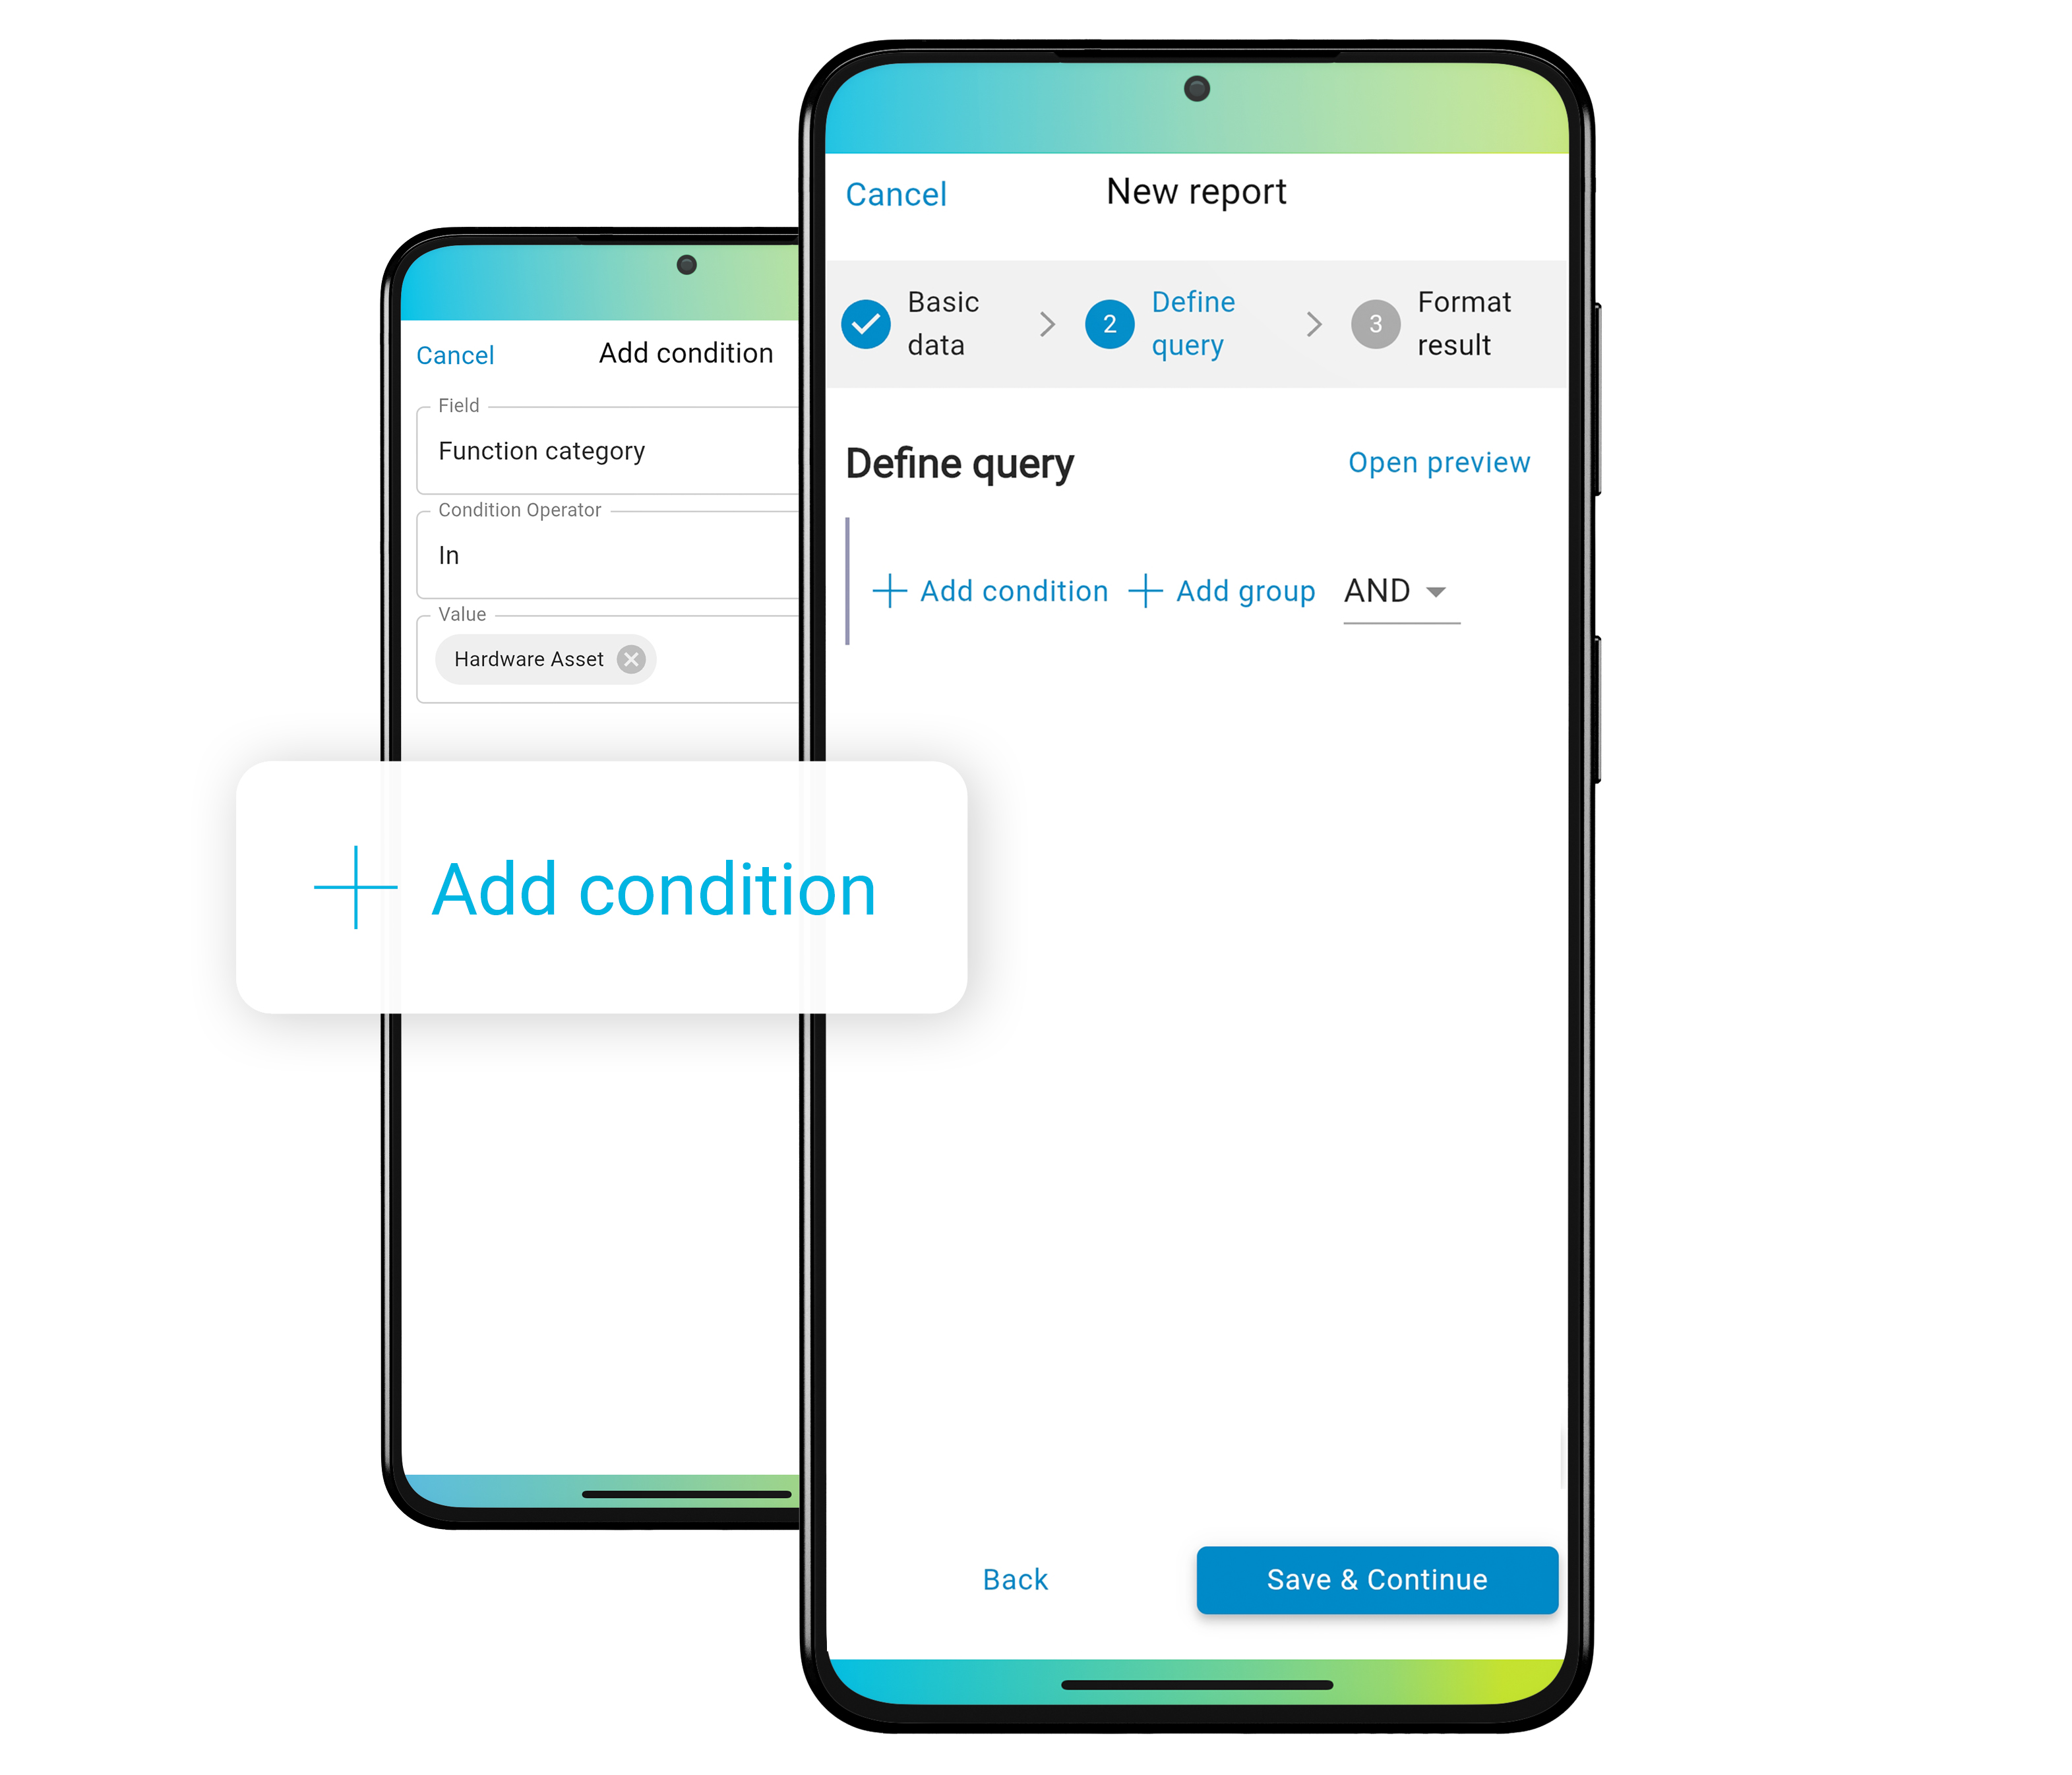
2. Add conditions and groups
Now define what your report will include.
Click Add condition to filter the specific data you want to see - like certain asset types or locations.
Use Add group to organize your data by categories such as business unit or lifecycle stage.
You can add multiple conditions and groups to tailor the report exactly to your needs.
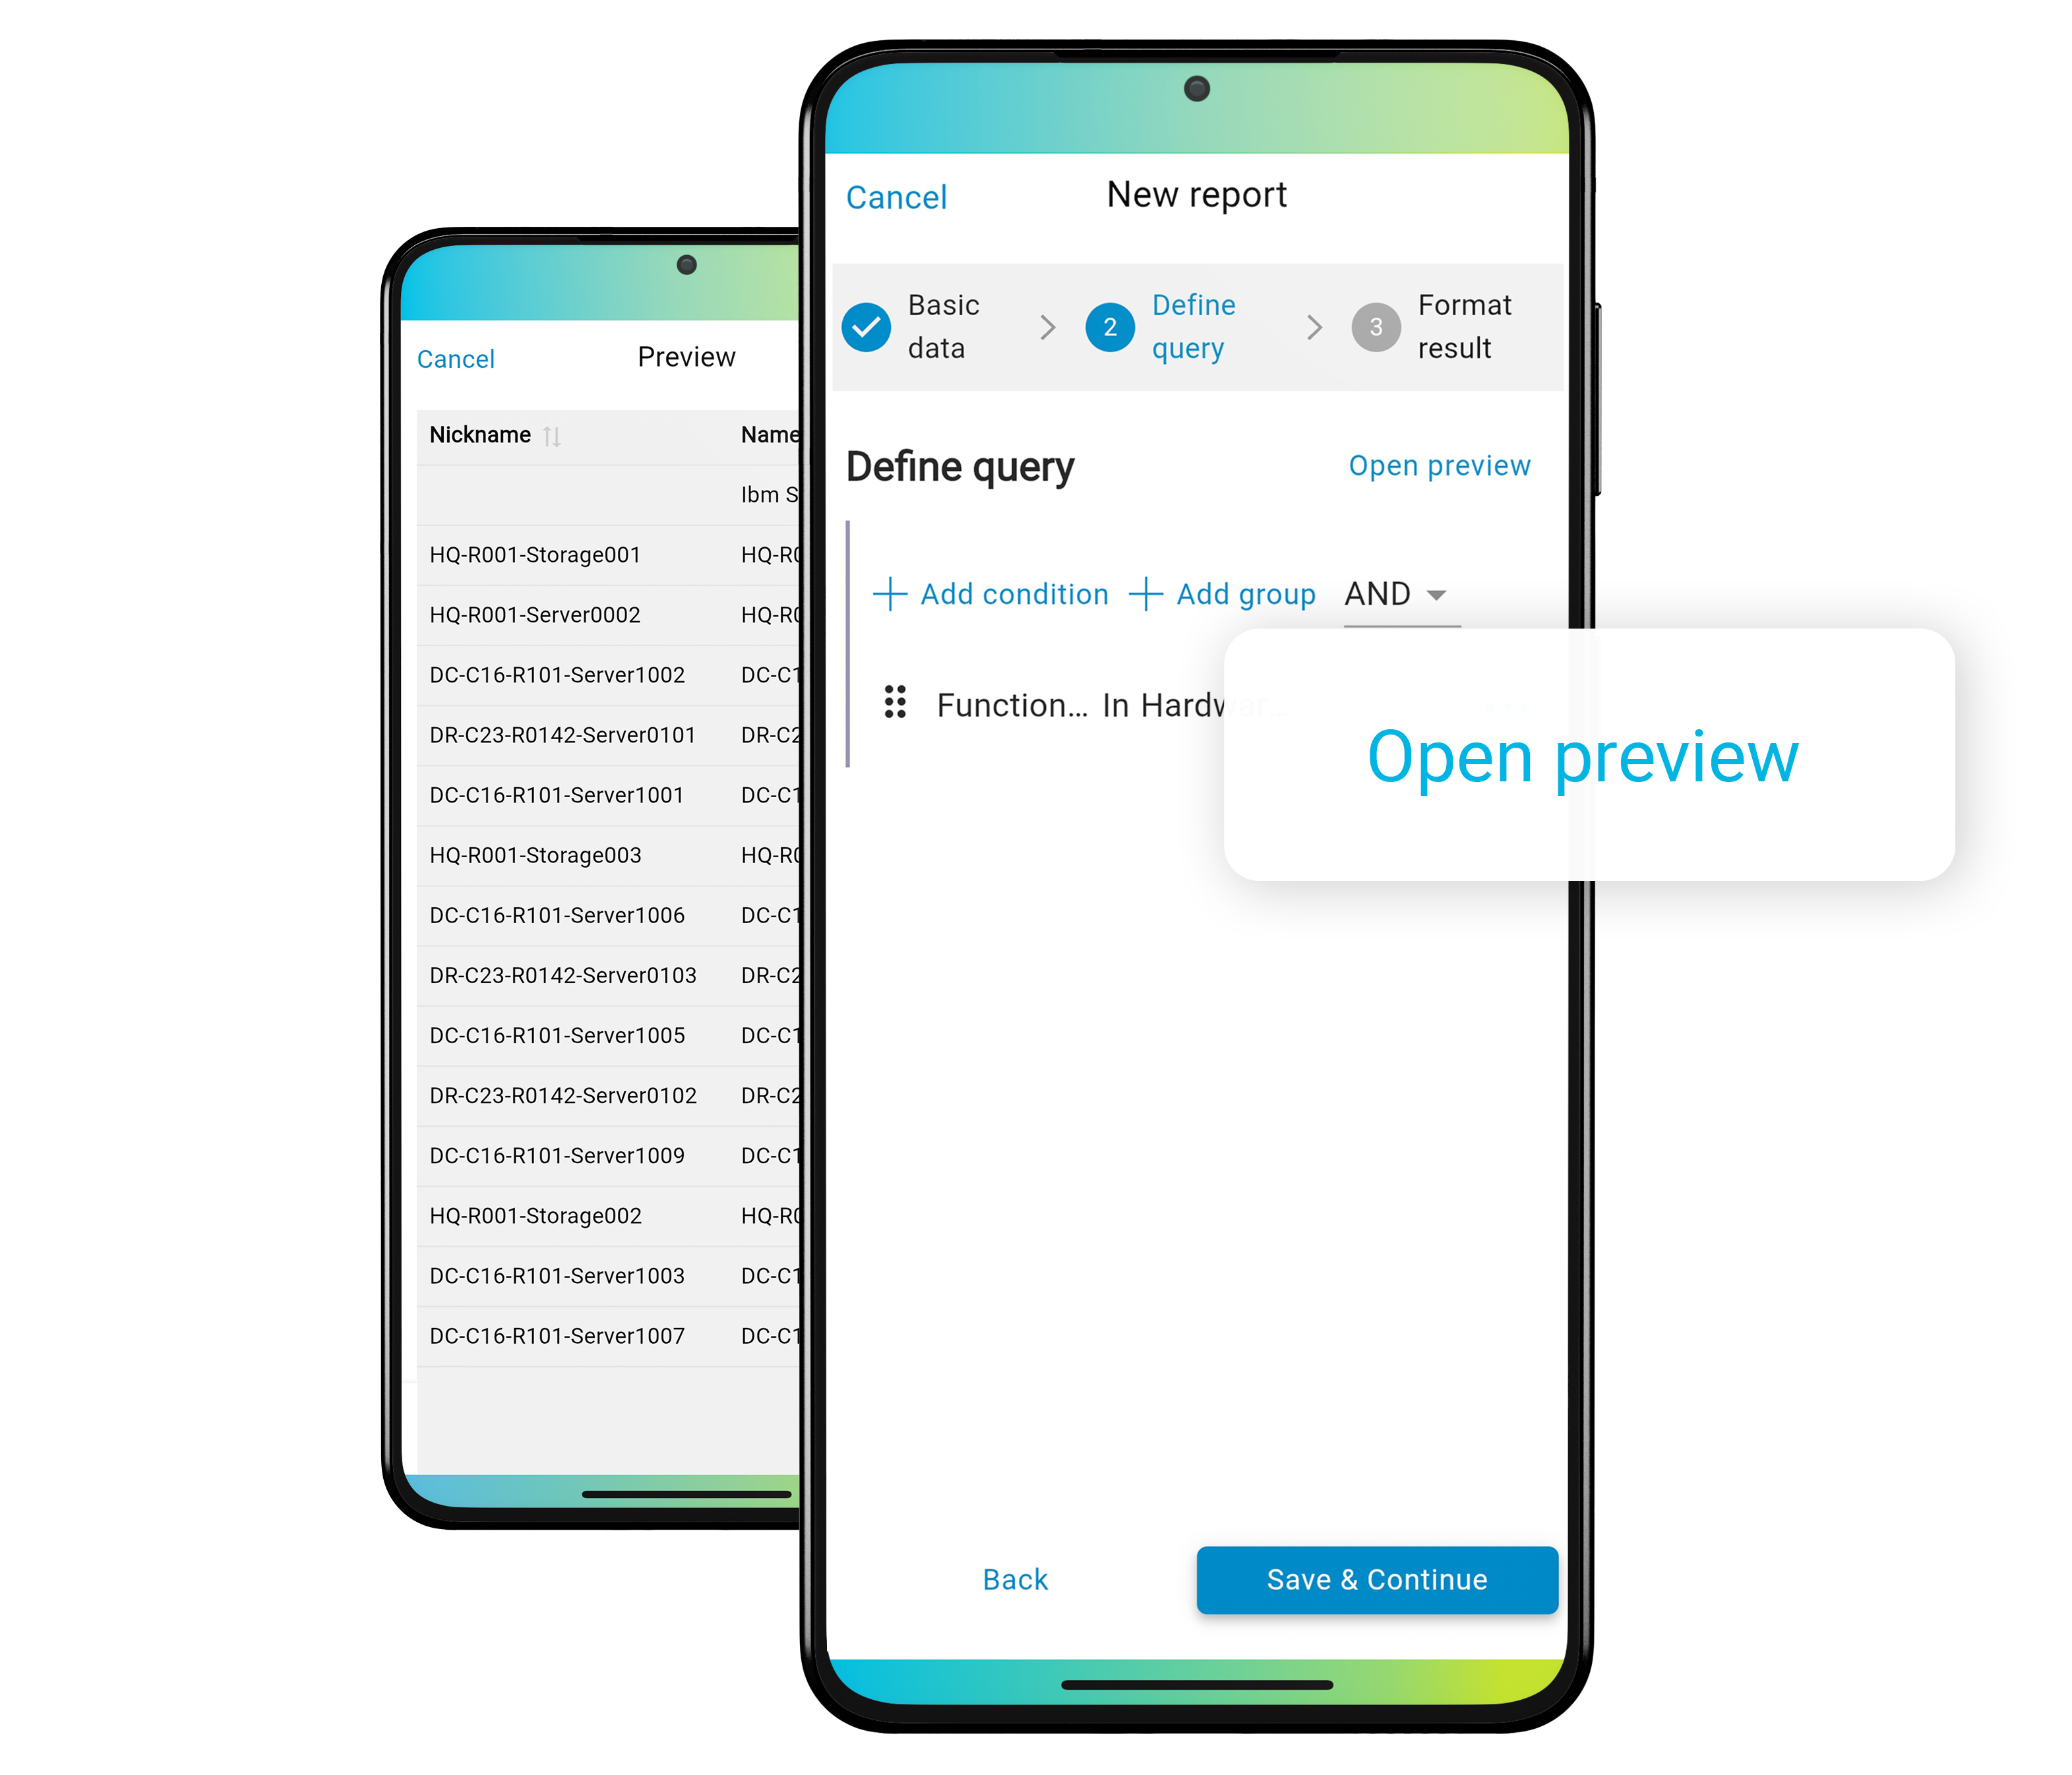
3. Preview the results
Once you've added your filters and groups, check your setup by opening the preview.
On desktop, it appears at the bottom of the page.
On mobile, tap Open Preview at the top of the screen.
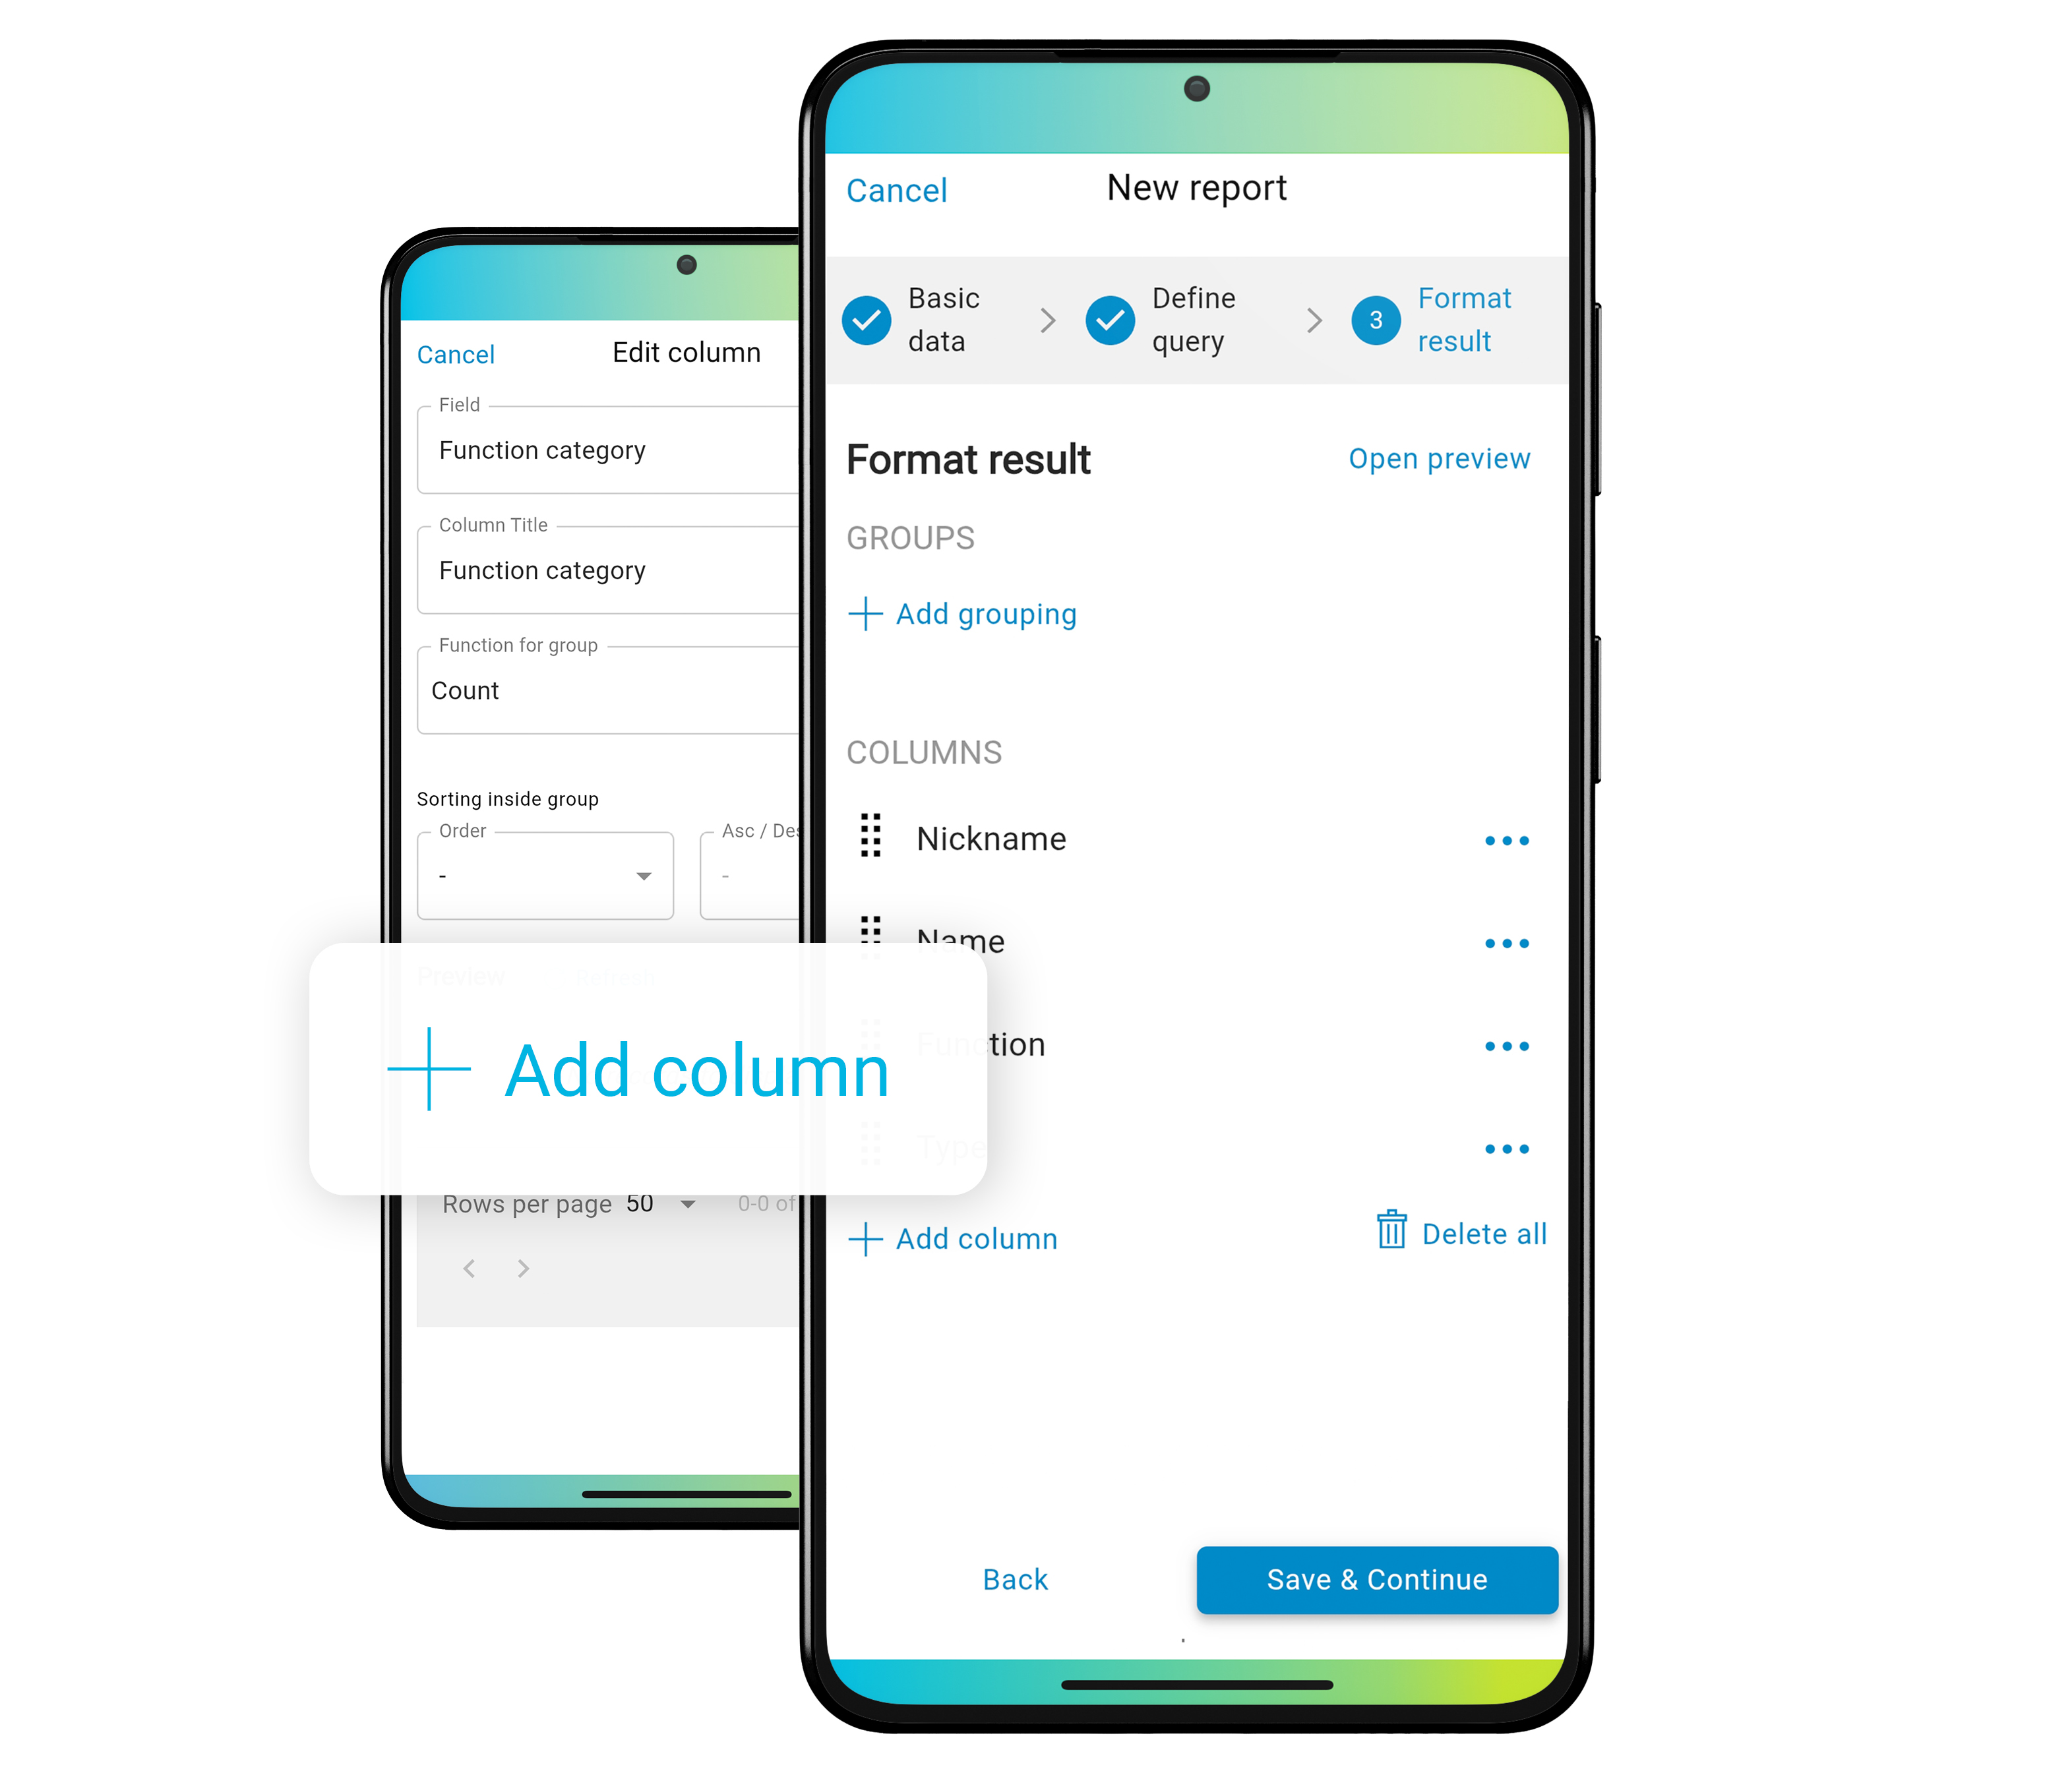
4. Format your report
If you're happy with the preview, it's time to format your report.
Select which values appear in the columns and choose the appropriate function for each group - for example, counting items or summing values.
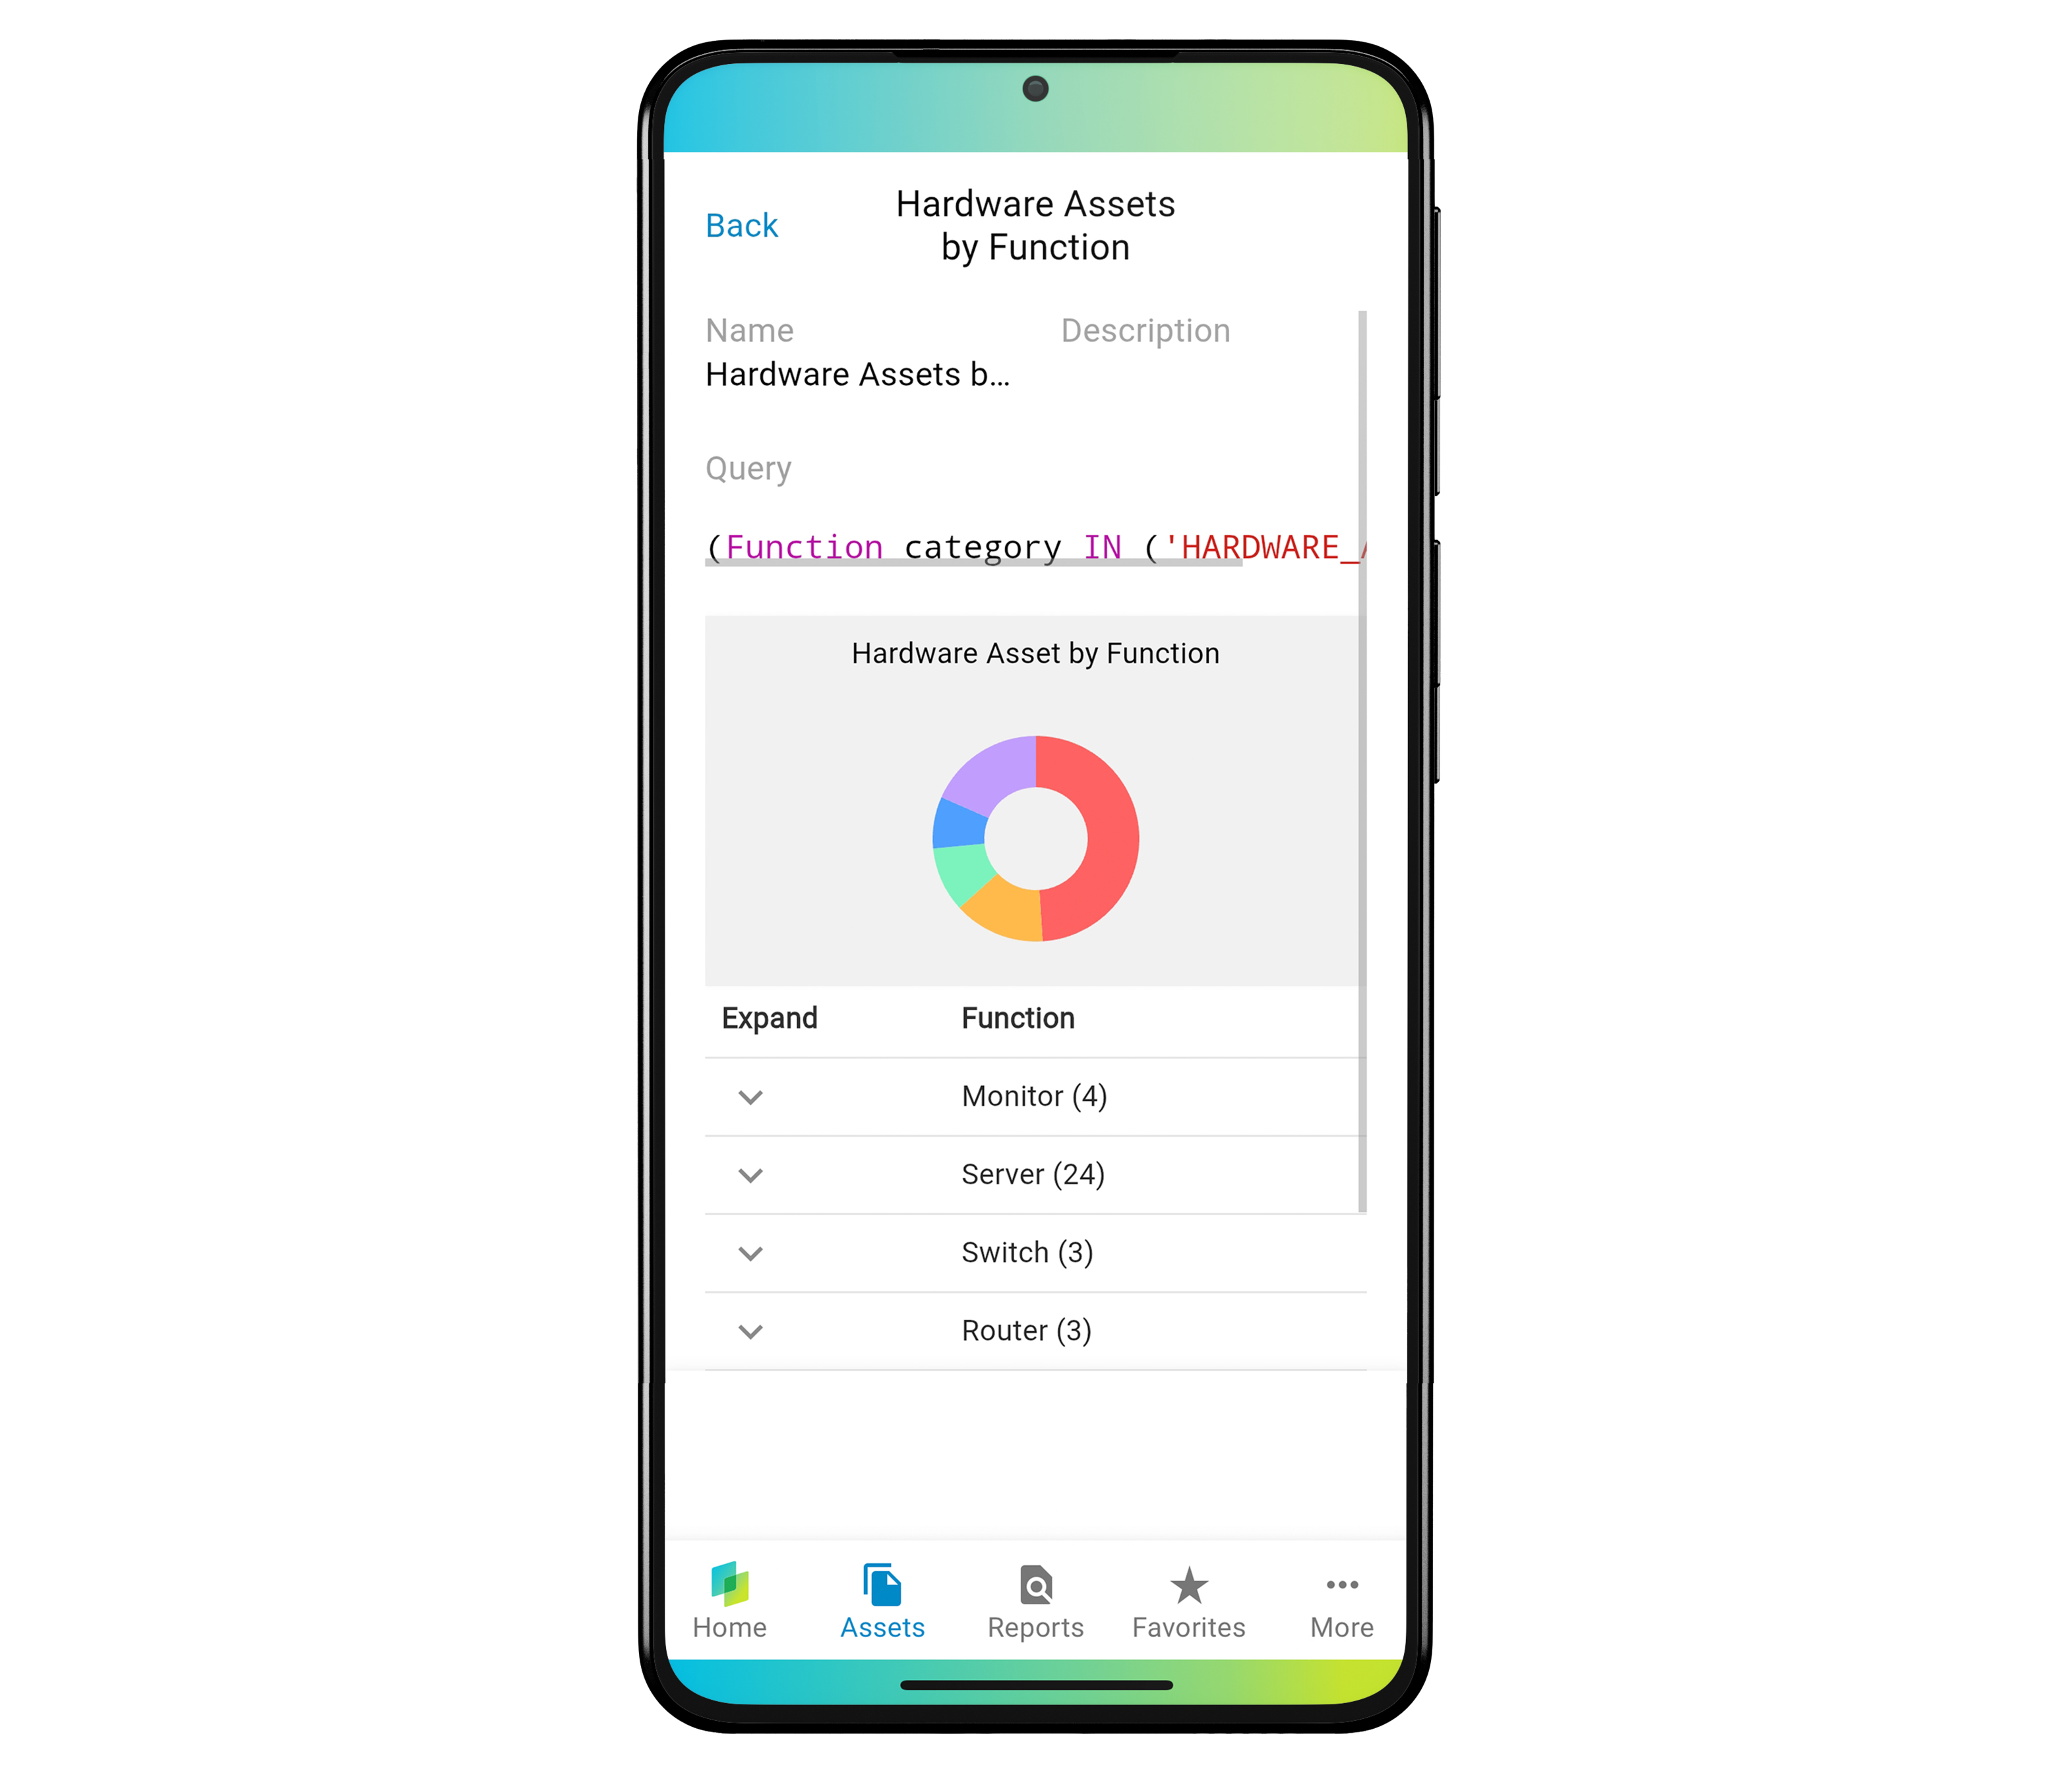
Then pick a widget to visualize your data, such as a table or chart.
3. Save and access your report
When everything is ready, click Save.
Your new report will now appear in the Reports section and can be accessed, edited, or shared at any time.